The National Red Index: how to turn the tide on falling living standards
On this page
Acknowledgements
This report was written by Meri Åhlberg, Emer Sheehy, Jonny Tatam-Hall, and Tess Thompson, with input and support from Oliver Heath, Eva Souchet, Morgan Wild, Tanya Yilmaz, and many others.
The National Red Index has been developed by Dr. Thomas Hunter, Dr. Lutfor Rahman, and Morgan Wild. It has had input and scrutiny from a panel of experts on economic analysis and policy-making. We are grateful to each of them for their time, expertise and challenge, including Dr. Tim Leunig, Dr. Peter Levell, James Browne, and Nye Cominetti.[1]
Any errors are the authors’ own.
Introduction
Negative budgets - a damning measure of living standards
We’re in the problem business. Our advisers help people with more of them than anyone else in the country - nearly 9 million a year. So we have a pretty clear view of the most urgent problems facing Britain as we head into an election year.
And it’s been heartbreakingly clear what the biggest problem is over the past two years: negative budgets. Last year, we sounded the alarm that half the people we help with debt are in a negative budget - where even after expert advice, they have more going out than coming in.
A negative budget is the ultimate red line between making ends meet, and being pushed deeper and deeper into trouble. Like quicksand, it’s hard to get out of once you’re in. And while negative budgets are the worst of this problem, so many more people come to us feeling like they’re just living on empty, running to stand still, worrying about what the future holds.
This is a stark warning that while our advice can be life changing, it’s not always enough to pull people out of the red and into the black. It’s not for lack of trying - negative budgets are a failure of policy, not advice. Successive governments haven’t addressed fundamental policy issues - especially the supply of affordable housing - leaving millions of households struggling to make ends meet on stagnant incomes.
So when the cost of other essentials like energy and food spun out of control in recent years, there was nowhere to go but down. People made tough decisions, cutting back on heating and eating, but this only takes you so far. Some costs can’t be cut.
The National Red Index - from Citizens Advice data to a national picture
Of course, the country at large is not like a Citizens Advice waiting room. We see people from all walks of life, in all their complexity. But we don’t see everyone.
Now, for the first time, we’ve used the unique data we get from the people we help at Citizens Advice to estimate how many people across the country are trapped in a negative budget.
We call it the National Red Index, and it’s our new way of understanding living standards. It uses detailed data from more than 300,000 people who have come to us for debt advice to understand what people at the sharp end of the living standards squeeze actually spend on costs like food, clothes and energy. It then uses national survey data on people’s incomes and fixed costs - things like rent and council tax - to determine how many people can’t afford their essentials, even if they were to cut their spending to the same levels as our debt clients.
This way of looking at living standards is tied to people’s lived experiences. It’s based on the real choices people make to stay afloat, and what they choose to prioritise when the chips are down. As such, it’s not an aspiration, it’s not even a minimum bar that we want to hold people above. It’s just the reality.
And that reality is staggering. Nearly 5 million people are in a negative budget, stuck in the red, building up debt to get by. A further 2.35 million are living on empty - only escaping a negative budget by cutting their essential spending back to unsafe levels, just to keep their heads above water. They’re breaking even, but only by going hungry, sitting in cold and damp homes, or not getting around as much as they used to.
What it will take to turn the tide
This situation isn’t sustainable. It should be a first priority for the government to solve. But how?
We shouldn't underestimate the scale of this challenge - there’s no silver bullet. When our advisers give people debt advice, they go through all the income, spending, and debts someone has to come up with a plan that’s specific and sustainable for them. They understand that the complexity of people’s situations means they need to look at the whole person. To solve the problem of negative budgets, we have to take that view into policy making.
To get people back from the brink, of course we have to invest in getting incomes - through benefits and work - back in touch with the real cost of living. But that won’t solve the problem without action on uncontrollable costs like energy, and especially housing.
These things won’t be fixed overnight. Living standards are in freefall for millions. Papering over the cracks won’t be enough. Politicians and policy makers know the challenge we face, and the importance of getting this right with an election on the horizon. But they also have to face up to a tough reality on spending, and no decisions will be easy.
A tool to assess policy change
Getting people out of the red and into the black is what our advisers specialise in, but they can’t tackle this scale of negative budgets alone. We need government to take tangible steps to shift the dial.
That’s where the National Red Index comes in. As a tool, it shows us - through the lens of negative budgets - how decisions made in Whitehall translate when they’re thrown into the complexity and connectedness of people’s real lives, and - crucially - what it would take to lift people back onto a secure footing for good.
This type of tool has never been more needed. We can see where governments should prioritise spending time and money to have the biggest impact on negative budgets. We’ve used our tool to identify where a new government, in their first 100 days, could start to shift the dial, without breaking the bank. As a priority, they should:
Legislate to uprate working-age benefits using inflation data from the Household Costs Indices, so they better reflect the true cost of living for low-income households.
Keep increasing the national minimum wage so more people in work can be lifted out of a negative budget.
Improve energy bill support by expanding eligibility for the Warm Home Discount and increasing support for those with the greatest energy needs.
Ensure affordable access to essential markets through social tariffs for water, broadband and motor insurance.
Reform the Local Housing Allowance so it better supports people with high private rent costs.
These changes would lift around 1.1 million people out of a negative budget and reduce the budget shortfall for millions of others. Overall, the negative budget rate would be cut by a quarter. These changes won’t transform people’s lives completely. In some cases they’ll just about tip them into the black. But this makes a huge difference. It’s the difference between being able to move forward and being constantly dragged backwards.
This should be seen as the first steps on the road to fixing negative budgets for good. Giving security to the millions living on empty is a generational challenge. But whether they can make a difference to this ultimate bottom line will be the key test for any new government wanting to claim success on living standards.
1. Key facts and findings
Someone is in a negative budget when their essential expenditure is higher than their income, leaving them out of pocket each month just from key living costs. The National Red Index shows us what negative budgets looks like on a national scale[2]:
5 million people, including 1.5 million children, are in a household with a negative budget.[3]
Another 2.35 million people are living on empty - they’re only escaping a negative budget by cutting their essential spending back to unsafe levels.
The problem is deepening - the average monthly deficit for a negative budget household has gone from -£270 in 2019/20 to -£365 in 2023/24.
Without government action, we expect that over 250 people will fall into a negative budget every day in the run up to the General Election.
Negative budgets disproportionately impact already marginalised groups, and risk worsening existing inequalities. On average, 1 in 15 households in Britain are in a negative budget compared to:
1 in 4 households receiving Universal Credit
1 in 5 single parent households
Nearly 1 in 10 households with a disabled person
Over 1 in 9 mixed race households and over 1 in 9 Black and Black British households are in a negative budget compared to 1 in 15 White households.
Housing costs, especially in the private rented sector, are a key driver:
Those who are exposed to rising housing costs are more likely to be in a negative budget - nearly 40% of low-income[4] private renters and just over 30% of low-income mortgage holders are in a negative budget, compared to 24% of social renters and 13% of owner occupiers.
Private renters in a negative budget are spending nearly two-thirds (64%) of their income on rent and nearly three-quarters (73%) of their income on rent and energy costs combined.
The real world consequences of living on empty or facing a negative budget are dire. In 2023, we helped record numbers of people who:
Needed foodbank vouchers to eat and feed their families
Couldn’t top up their prepayment meters to heat or light their homes
Faced eviction, homelessness or threatened homelessness due to unaffordable private rents.
2. The National Red Index - what is it and why does it matter?
From Citizens Advice data to a national picture
How do we determine who is in a negative budget? Our debt advice helps people go through all their income and spending to set a minimal, sustainable budget. We call this their ‘revealed basic needs’ - following help from an experienced adviser, people arrive at a budget that will allow them to meet essentials while paying back their debts over the medium to long term. Since 2019, more than 300,000 people have gone through this process with us, giving us one of the largest and most detailed datasets on the spending choices of people at the sharp end of the living standards crisis.
From this dataset it’s easy to calculate what the negative budget rate is for our debt clients. We simply subtract each person’s expenditure from their income. Anyone whose expenditure is higher than their income is in a negative budget.
But we know that our debt clients aren’t representative of Britain’s population as a whole. By definition they’ve come to us because they’re struggling financially and need our help.
To get to a nationally representative figure of negative budgets, we need to combine our debt client data with a national dataset. We chose the ONS Living Costs and Food Survey (LCFS) because it includes data on income and spending. We take what our debt clients spend on flexible costs - things like food, clothing, and groceries that you can change your spending on when your finances are squeezed - and combine them with LCFS data on fixed costs - things like rent and council tax that are hard to change. This gives us an overall figure for spending on essential costs, which we adjust for things like how many people live in the household, where they live, and if anyone in the household is disabled.[5] We then subtract this overall spending figure from income data from the LCFS.
We also adjust spending and income levels based on inflation to give us an up to date picture.[6] This is complex, as different measures of inflation will give different results. We've recently looked at how Consumer Price Index (CPI) inflation underestimates the real impact of inflation for people on low incomes. We can see this play out in the National Red Index. When we calculate the negative budget rate using CPI inflation, it underestimates the number of people in a negative budget by around 619,000, compared to when we calculate it using the Household Costs Indices (HCI) inflation, which is more accurate to the experience of low income households.[7]
This analysis allows us to see what the negative budget rate looks like on a national scale. We think this is a more realistic insight into what people need to get by than existing living standards metrics, because it’s grounded in real experiences. It’s the outcome of real people at the sharp end of the squeeze on living standards determining - with the help of an experienced debt adviser - what a minimal but sustainable budget looks like for them. Other measures of what people need are based on asking people what is necessary; ours reveals it.
Using the National Red Index for policy making
Using negative budgets as a measure of living standards is also more amenable to targeted policy evaluation. It’s a tall order for policy to bring everyone up to a set standard of living as an invariable benchmark. With the National Red Index we can demonstrate where policy would have the largest return on reducing severe hardship.
Negative budgets are a simple equation: does your income exceed your essential expenditure? Our model treats both equally: it is analytically relaxed as to whether the solutions come from increasing benefits, raising wages or tackling some of the big costs that people face. Longer term, affording the essentials can equally come from sustained increases to social security spending or through making housing, energy or other essential services more affordable.
Because the National Red Index is built on such detailed income and expenditure data, we’re able to look at the full range of policies that you might implement to improve living standards. This includes majoritarian policies, like raising the minimum wage, as well as more targeted ones, like reforming support through housing benefit. We can also see how these different policies would interact with each other.
Policymakers should sit up and listen to this type of insight. As we move towards a general election, politicians will be sharing their visions for the future, and how they plan to tackle some of the challenges facing the country. But you would be surprised by how many politicians and policy makers don’t have experience of - or even access to information about - the sorts of problems our advisers help people with day in and day out. Without this view of what’s really happening on the ground, they risk missing the biggest issue facing the country in the coming years - how to get people out of a negative budget for good.
We’re living through difficult economic times. The next government, whatever their political stripe, will have to operate within tight fiscal constraints. That’s why when money is spent, and policies are implemented, they must make a real difference for people who feel they are living on empty. Every policy needs to be rigorously tested on its effectiveness at helping people out of a negative budget. This will be the key test for whichever government wins the election this year.
3. Who is in a negative budget?
5 million people are in a negative budget, and many more are on the brink
Our analysis shows that more than 2.1 million households are in a negative budget. That’s 5 million people - including 1.5 million children - who are in households that can’t afford basic essentials and are at risk of being pushed into debt.
The number of people in the red has jumped by more than 54% since the start of the pandemic - that’s an increase of nearly 1.75 million people.
Another 2.35 million people are living on empty[8] - they’re only escaping a negative budget by cutting their essential spending back to unsafe levels. In other words, they’re breaking even, but only by going hungry, sitting in cold and damp homes, or not getting around as much as they used to. They don’t have any resilience against unexpected costs, and they feel like they’re having to run hard just to stay still.
Those in the red are sinking deeper each year
We can also see that those who are already in the red are struggling more than before. The average monthly shortfall of a household in a negative budget has gone from -£270 in 2019/20 to -£365 now. As this figure is an average, it includes some households who have an extremely deep deficit, as well as others who are only just in the red. But this trend indicates more people are being sucked deeper into trouble. We can see a similar trend when we look at what our debt clients who are in a negative budget are experiencing - their average deficit has gone from -£208 in 2019/20 to -£369 now.
Over the course of the coming financial year, unless incomes go up or costs come down, households in a negative budget will face a shortfall in their budget of more than £4,200 each.
On a national scale, that would add up to a shortfall of more than £8 billion in just one year from essential living costs.
For some people, this will mean running down their savings, or getting help from family and friends. For others, it’ll mean cutting back even more to try and keep their heads above water. This is really worrying as we know that more than 3 million people have been disconnected from their energy in the last year - including more than 1.4 million since November 2023 - because they couldn’t afford to top up their prepayment meter.
For many more, it’ll mean falling behind on bills or borrowing to get by. We’ve seen a huge increase in people needing help with debt on household bills like energy and council tax in the last year, and the amount of debt people owe is also increasing.
Debt like this is not a problem that will go away quickly. To get to a point where there's even a prospect of paying back debts, people have to move from a negative to a positive budget - so they have a surplus to use for repayments. For the average person in a negative budget, this would mean either increasing their income, or reducing their essential spending, by around £415 per month, just to have a surplus of £50 for debt repayments. In this way, negative budgets are like quicksand - once you’re in it’s hard to get out, and easy to sink in deeper.
Marginalised groups are the worst affected
Disabled people, racially minoritised groups, single parents, and people receiving Universal Credit, have some of the highest negative budget rates, and the deepest deficits. If things continue as they are, we’ll see these groups who already often experience multiple disadvantages held back further.
The share of people in a negative budget by demographic group
33% of households in a negative budget receive Universal Credit. Overall, nearly 1 in 4 households receiving Universal Credit are in a negative budget.
20% of households in a negative budget include someone with a disability. Overall, around 9% of households that include someone with a disability are in a negative budget. This jumps to 23% for households with a disabled person that don't receive disability benefits.
13% of households in a negative budget are single parent households. Overall, just under 1 in 5 single parent households are in a negative budget.
Over 1 in 9 mixed race households and over 1 in 9 Black and Black British households are in a negative budget compared to 1 in 15 White households.
But we can also see new, unexpected groups - like pensioners - being dragged under. Households with someone aged over 65 who are privately renting are 3 times more likely to be in a negative budget (15%) compared to similar households as a whole (5%), and nearly twice as likely as those in social housing (8%).
4. What does it mean to be living on empty?
Every day our advisers see people forced to make difficult choices - about what bills will go unpaid, who to ask for money, what opportunities you have to pass on, and what essentials to go without. Here are three stories from the nearly 80,000 people we helped make a budget plan in 2023.[9] Of this group, 50% were still in a negative budget even with our advisers’ help.
Abigail’s story - paying rent or council tax
Abigail works part-time and receives benefits, but her income isn’t enough to cover her and her daughter’s essential expenses. She can’t afford to pay her council tax and has built up nearly £5,000 in arrears. Half of Abigail’s income goes to her rent, and there just isn’t enough left for her other essentials and council tax too, let alone paying off her debt. She’s missed rent payments before and is worried about the consequences if she misses a payment again.
I don’t know what to do. I get paid tomorrow, but it’s for my rent. I can't miss that as I would be homeless because of the arrears.

Grace’s story - choosing between heating and eating
Grace is pregnant, and isn’t in paid work as she cares for her toddler. All of her income is from benefits, but this isn’t enough to cover her family’s essentials. Grace is worried about managing her debts, especially energy, and feeding her family. She’s already on a prepayment meter for gas and has electricity debt she can’t afford to repay. With little money left in her bank account, Grace is facing a really hard choice: does she pay for energy to keep the lights and heating on, or does she buy food for herself and her young child?
This is like torture for my family.

Peter’s story - energy disconnection or asking friends and family for money?
Peter can’t work because of his physical and mental health conditions. He receives benefits, but still can’t afford his family’s expenses. He has over £1,500 in energy arrears and his smart meter has been switched to prepayment mode. Peter has disconnected several times because he can’t afford to top up his meter. His only option when this happens is to ask family and friends for money, which makes him feel undignified. But he’s made the tough choice to do this so he can keep the power running for his family.

The consequences of this nightmare new normal - where millions of people are in a negative budget - are clear from our data. We're seeing more and more people coming to us for debt advice - and the severity and complexity of their debt problems is growing.
Many of these people come to us in crisis. In 2023, we helped record numbers of people who:
Couldn't afford to eat, so came to us for foodbank vouchers.
Couldn't afford to top up their prepayment meters to pay for heating, hot water or electricity.
Couldn't afford to pay rent to their private landlord, so faced eviction, homelessness or the threat of homelessness.
If we look at these crisis issues specifically in the context of negative budgets, we see that, of the almost 40,000 people we helped in 2023 who were in a negative budget:
over 1 in 5 needed a foodbank referral
nearly 1 in 8 couldn’t afford to top up their prepayment meter, and
1 in 20 needed help with a homelessness issue.
For most people, cost of living issues don’t exist in a vacuum. Living on empty can cause a snowball effect, so when people need help with one issue, they often need help with another. The people in negative budgets that we helped in 2023 needed support with an average of 18 issues over the course of the year.
5. What’s driving negative budgets?
Our data helps us understand what’s pushing people into negative budgets. We’ve identified four key drivers and how they relate to each other. Benefits have fallen far behind the true cost of living over the years, and income from work has also not kept up. This means it’s very hard to cope with high costs, including sudden price rises - like those brought on by the energy crisis - and the ongoing high cost of housing, which has continued to push people over the edge, especially in the private rented sector.
Income from benefits hasn’t kept pace with the true cost of living
Benefit payments for working-age people have not kept up with the cost of living. While benefits were uprated by the Consumer Price Index (CPI) inflation last year, and will be again next year - their value has never recovered from being frozen between 2015 and 2020. If benefits had kept pace with CPI inflation since 2015 then, by 2024/25, a Universal Credit payment for a typical family of four would be £89 higher per month, and £1,064 higher per year.[10]
But, to have kept pace with the real rise in living costs for low-income households, benefits should have increased by even more. Low-income households have been hit harder by inflation because they spend more of their income on essentials, like energy and food, which is where we’ve seen the steepest price rises. But until now measures of inflation haven’t reflected this.
A new, more accurate measure of inflation for people on low incomes comes from the Household Costs Indices (HCI). This shows that for the bottom 30% of the income distribution, inflation has been 4 percentage points higher than CPI over the past two years. But if you take a longer view, the difference is even starker - from January 2005 to now, inflation for the bottom 30% has been 12% higher than CPI.
If benefits had increased with this measure of inflation since 2015, a Universal Credit payment for a typical family of four would be £121 higher per month and £1,450 higher per year by 2024/25.[11]
Many people have their benefits further eroded by deductions and sanctions, further pushing them into hardship. This, plus the disconnect between how benefit rates are set and the actual cost of living, explains why 1 in 4 people receiving Universal Credit are in a negative budget.
Work isn’t paying
Wages have gone up in recent years - thanks in part to increases to the National Minimum Wage (NMW - also known as National Living Wage). But rising costs mean that real terms earnings have been stagnant for years, while labour market and welfare policy have pushed more people into insecure and low quality jobs. Many people just aren’t making enough to get by.
The National Red Index shows us that of all the households in a negative budget, 1 in 3 include someone who is in work. That’s 636,000 working households who can’t afford their essentials. More than half of these households include someone who is working full time.
But people working part-time are more likely to struggle. People who work less than 15 hours a week are 4 times as likely to be in a negative budget (12%) than people working full time (3%). Nearly 1 in 10 people who work 16-34 hours per week are in a negative budget (9%). That’s 314,000 people who are working part-time yet struggling to put food on the table and keep their home warm. This necessarily affects people who don’t have any choice but to work part time, like single parents, and people with caring responsibilities. Single parents working 16-34 hours per week have a negative budget rate of 17%.
High energy costs
Energy costs started spiralling in 2021, and are still at historically high levels. While energy prices have fallen from the peak of last winter, they’re still nearly 60% higher than in winter 2021/2022. Some respite may be on the horizon, with prices predicted to fall somewhat from April - but this won’t be enough to fix the crisis. Bills will still be over 40% higher than they were in 2021. And, as households aren’t receiving the same government grants for energy bills this year, nearly half of the poorest households will be paying more for their energy this winter compared to the last.
Households in the bottom two income deciles are now spending 11% of their total income on energy costs - nearly doubling from 6% in 2020-21.[12]
Consistently high housing costs
How much you spend on housing is now the key determinant of whether you’re likely to be in a negative budget.
For low-income mortgage holders, the rise in costs has been recent and very sharp. Among the people we help with debt advice, monthly mortgage payments have risen by £161 in the last 2 years (from £429 to £590) — a 38% increase. On a national scale, 400,000 households with a mortgage are in a negative budget - 80,000 more than in 2021/22. Among mortgage holders in the bottom income quintile, 32% are in a negative budget - up from 28% in 2021/22.
For private renters, there’s a longer-term story. If we look at people who come to Citizens Advice for help, we can see that private rents have been increasing steadily for years. Rising costs have been felt more sharply by people who have to move often - rents for new lets are up 10% since last year compared to overall average rent inflation of 6.2%. The private rented sector is inherently insecure meaning many people have to move often - last year we helped more than 18,000 private renters with Section 21 ‘no fault’ evictions.
On average, low-income private renters are spending nearly half (48%) of their income on rent, compared to 37% for social renters. For private renters in a negative budget, this rises to nearly two-thirds (64%) of their income being spent on rent. For social renters in a negative budget it’s just over half (53%).
And when you include energy costs, private renters in a negative budget are spending nearly three-quarters (73%) of their income on just rent and energy alone.
Social renters on low incomes are struggling, and many face negative budgets. But, because they have lower rent costs, which are generally covered by housing benefit payments, they have some protection compared to those on similar incomes who rent privately.[13] Low income private renters have to rely on support through Housing Benefit or Universal Credit which is capped by the Local Housing Allowance, so there is often a significant shortfall between this and actual rent costs. This helps illustrate the need for more social housing - many people on low incomes have been pushed into more expensive, and less secure, private rented housing, putting them at higher risk of facing a negative budget.
6. What can the government do to fix this?
As we look ahead to a likely general election this year, the squeeze on household budgets will be a defining issue for voters. Looking at living standards through a negative budget lens not only shows us what’s driving the problem, but also the action the next government could take to start fixing it.
Taking the holistic view of policy-making that negative budgets gives us, we can see that fundamental changes are needed to meet the scale of this challenge.
Incomes have not kept pace with the real real cost of living. This is in part because of policy choices taken to reduce the value of benefits over many years. Investment is needed to ensure that benefits reflect the actual living costs of those on the lowest incomes.
There are a few ways to do this, including restoring working-age benefits to 2015 levels - before cuts and freezes - or ensuring that benefit payments are at least enough to cover essential costs through an Essentials Guarantee, as recommended by the Joseph Rowntree Foundation and the Trussell Trust. For example, the latter would lift more than 483,000 households - more than 1.1 million people - out of a negative budget, if implemented now.
Alongside investing in the benefits system, work needs to pay enough to live on. This is in part about wages - and we’ve discussed the escalation of National Minimum Wage policy more below - but also about the type of work people have access to. Ensuring people can access good work, with proper security, meaningful rights, and support when they’re sick, will be vital if we want to reach a point where no-one who is working faces a negative budget.
But our analysis shows that you can’t tackle this problem just by focusing on incomes. We also need to tackle high essential costs.
An obvious place to start is energy. There’s a need for urgent action to protect people now, as we predict that we will help more people this winter who can’t afford to top up their prepayment meter than in any other winter on record. But ultimately we need to get to a point where we aren’t re-running the same crisis every winter. Last year, we set out how government-funded, targeted energy bill support - alongside improved energy efficiency schemes - could help to sustainably make bills more affordable for those spending an excessive proportion of their income on energy.
More broadly, we should be challenging ourselves to think about how all essential markets can work better for low income consumers. We’ve written more about the role that social tariffs - lower costs for essential services for people on lower incomes - can play in reducing negative budgets below. They should also be seen as a preventative measure, ensuring access to affordable essentials for all.
But ultimately, you can’t fix negative budgets without tackling housing. We’ve seen that ever increasing private rents have been driving millions towards negative budgets. While those in social housing aren’t immune, the cheaper rents and security of tenure provided by a social tenancy does give some protection from a negative budget. But after decades of policies that have reduced the supply of social housing, there are now 1.5 million fewer social homes than in 1980, and a waiting list of over 1 million people.
Is social housing the answer to negative budgets? We used our National Red Index to model what could happen if you moved all private renters on means-tested benefits into social housing. We found this would lift 211,000 households, or nearly half a million people, out of a negative budget.
You can’t build houses overnight. But addressing the social housing shortage, and enabling more low-income private renters to access social housing, must be a vital part of any plan to deal with negative budgets. There are lots of ways of achieving this, and many organisations, among them Crisis and Shelter, have outlined plans for doing so. What’s clear is the need for the government to start acting on this, and fast.
Steps the next government can take within the first 100 days
We’ve seen in recent years that the government has responded to cost of living pressures with temporary support, which has helped for short periods, but isn't a sustainable solution to the scale of the problem we’re facing. The changes described above are vital for tackling negative budgets, and are achievable with the right political will. But many of them require big, structural reforms that will take time and resources to get right.
So, what action can be taken to start shifting the dial on negative budgets for good? Where could existing systems be made to work better for the people they’re meant to support? What levers will a new government have available quickly to give some relief to struggling households?
Any new government will have tough decisions to make in terms of spending. So, they’ll need to prioritise interventions that are the most effective. Our insights allow us to compare the impact of different interventions on the number of households who are in a negative budget - how many people will be lifted out of the red and into the black. These changes will also make a big difference for those in positive budgets - they won’t have to cut back as hard or as far, they’ll be better able to manage unexpected costs, and they’ll have a bit more room to breathe.
1. Legislate to uprate working-age benefits using inflation data from the Household Costs Indices, so they better reflect the true cost of living for low-income households
We’ve seen that cuts and freezes to benefits, plus policies like deductions and sanctions which eat away at what people are entitled to, have left millions struggling to cope. But we’ve also seen that the actual measure used to calculate benefit increases makes a big difference.
Even if working-age benefits had risen each year since 2015 by CPI inflation, they would still have fallen behind the real cost of living for low-income households.
Restoring benefits to what they would be if they’d been uprated by the relevant HCI rate since 2015 would lift over 200,000 households - or 480,000 people - currently on means-tested benefits out of a negative budget.[14] This should be the ultimate goal, but won’t be achieved immediately.
As a first step, the government should ensure future uprating is calculated using HCI, and put this commitment into legislation. Given HCI more accurately reflects the reality of price increases for low income households, uprating by anything less than this would essentially amount to a real-terms cut.
This initial step would still have a significant impact. If it was implemented in April 2024, alongside the government’s proposed minimum wage rise, uprating benefits by the relevant HCI rate would lift 97,000 households out of a negative budget.[15] In comparison, the current approach to uprating, which will use the September 2023 CPI inflation rate of 6.7%, would, together with the government’s proposed minimum wage increase, lift over 44,000 households out of a negative budget.[16]
2. Keep increasing the National Minimum Wage so more people in work can be lifted out of a negative budget
Too many people in work are still living on empty. Raising the National Minimum Wage is a lever a new Government could pull to increase people’s incomes from work, without any additional burden on the Exchequer.
The government is planning to raise the National Minimum Wage to £11.44 per hour in April 2024, to achieve its target of a NMW at two-thirds of median earnings.
But we shouldn’t stop there. The Living Wage Foundation has set the real living wage at £12 an hour for people outside London and £13.15 for people in London. This is calculated using a basket of household goods and services and aims to reflect the real cost of living. If the NMW was raised to the level of the real living wage, it would lift over 80,000 households out of a negative budget.
There’s scope to go even further with this policy. International studies looking at the impact of minimum wages within United States counties found that even minimum wages at 81% of median earnings had a limited impact on job losses. The Resolution Foundation has proposed a NMW that reaches 73% of median earnings by the end of this decade, while the TUC has called for the government to set a new target for the NMW to be 75% of median earnings.
To give a sense of the potential impact of this policy, we modelled a NMW at 75% of current earnings (£12.87), which would lift over 110,000 households currently in a negative budget into the black.[17]
3. Improve energy bill support by expanding eligibility for the Warm Home Discount and increasing support for those with the greatest energy needs.
The Warm Home Discount (WHD) currently provides an energy discount of £150 for around 3 million eligible households. In 2014 it was worth 12.5% of the average bill, but now only makes up just under 8%.
This is currently not enough to prevent millions from being unable to afford their energy bills, and being plunged into debt. By the end of this winter, we estimate that over 2 million people on prepayment meters will disconnect because they can’t afford to top up. Meanwhile, the total energy debt pile has reached at least £2.9bn - and is growing.
Our analysis shows that while increasing the existing WHD would help, it is too narrowly targeted. To support millions of low income households struggling with energy bills, we’ve proposed a tiered WHD which could be implemented in a relatively short timeframe.
This would expand eligibility of the WHD to 5-6 million low income households (out of 7.8 million GB households on means-tested benefits) and target increased support of up to a third of a typical bill (currently around £600) for households with the highest energy costs. It would be more tailored to needs and avoid steep thresholds for eligibility by providing a lower level of support to those with lower energy costs. It would also remove the steep cliff edges that would arise from simply increasing the existing WHD, and be responsive to changes in energy prices.
We've modelled a version of the WHD that provides £600 to the 1.95m households on means-tested benefits with the highest quarter of energy costs, with subsequent quarters receiving £400, £200 and nothing for the bottom quarter.
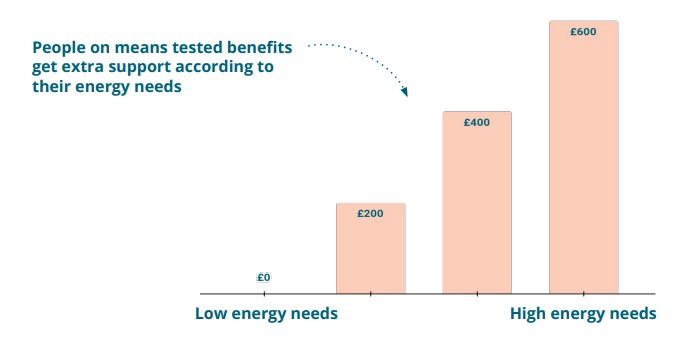
This approach would lift 97,000 households out of a negative budget and reduce the budget shortfall for millions of others. It would cost approximately £1.9 billion (in addition to existing £450 million spending on the WHD). There are ways this could be funded within the existing spending envelope for energy bill support, while improving fuel poverty targeting significantly. We have explored these funding options further in our report Shock Proof.
4. Ensure affordable access to essential markets through social tariffs for water, broadband and motor insurance
We’ve seen that the rising cost of energy and housing are pushing people into negative budgets - but we’ve also seen that many people have been forced into cutting back on other essentials to make ends meet. Last year, we found that a million people disconnected their broadband, between early 2022 and 2023, because they couldn't afford it. Alongside levers to increase incomes, a targeted package of social tariffs across several key consumer markets could both make essential costs more affordable for people on low incomes, and make a difference to negative budgets.
Here, we propose social tariffs for water, broadband and motor insurance, where we have clear evidence of people being priced out and where, for water and broadband, there are existing mechanisms to build on. However, it’s worth noting that other essentials could be candidates for social tariffs in the future.
Existing social tariffs in the broadband and water markets already offer discounts of around 50%, but there are many issues with the current level of provision, including low take-up and postcode lottery effects.
If these kinds of discounts were consistently available, and accessed by a much higher proportion of those who need them - for example by automating take-up for eligible customers - they could help ensure that people on low incomes can access these markets without the need to cut back elsewhere. Reducing the cost of essentials overall would also help to address negative budgets.
As an initial proposal, we've modelled the impact of the following discounts. This assumes a 100% take-up rate through automating take-up for eligible consumers:
Water: The recommendation made by the Consumer Council for Water for a single social tariff for water, where no one pays more than 5% of their income after housing costs on their water bills.
Broadband: a 50% discount for households on means-tested benefits.
Motor insurance: a 50% discount for households on means-tested benefits.
Taken together, these would lift 72,000 households out of a negative budget. It is possible to implement these social tariffs with little or no cost to the Exchequer. We expect these would either be funded via cross-subsidies between consumers, which is how existing social tariffs in water and broadband are funded, or through a levy on industry profits (or a combination of the two).
5. Reform the Local Housing Allowance so it better supports people with high private rent costs
The Local Housing Allowance (LHA) sets the amount of benefits income (from either Housing Benefit or Universal Credit - Housing Element) which private renters can get to help with their rent costs.
After being restored to the 30th percentile of local market rents in April 2020, LHA has been frozen while rent costs have soared. This has led to a growing shortfall between private renters’ housing support and their rent costs. Among the private renters we help with debt advice who are on Universal Credit, this monthly shortfall has grown from £98 to £157 between 2020-21 and 2023-4.
Permanently fixing the LHA rate to market rents, starting at the 30th percentile
In the 2023 Autumn Statement, the Government announced that LHA rates will be restored to the 30th percentile in April 2024. This is expected to cost £1.3 billion, compared to maintaining the freeze at 2020/21 levels.
The Department for Work and Pensions has estimated that 1.6 million households will gain and on average these households will benefit by £785 per year, or about £65 per month, in 2024/25. Among our debt clients renting privately and on UC, we estimate that this will reduce their monthly LHA shortfall by £50. Nationally, this change will lift 58,000 private renting households out of a negative budget.
But LHA is set to be frozen again from 2025 - and if private rents continue to rise at the same rate, then the gains made in April 2024 will soon be lost. So, at the very least, LHA needs to be permanently attached to the 30th percentile of local rents. Even with this commitment, many people will still face a significant shortfall between their rent costs and housing support, because the way LHA is structured is detached from the reality of the rental market.
LHA has been set at the 30th percentile since 2011 (previously it was linked to median local rents). This assumes that all private renters on benefits can, and should, find a home that’s within the 30th percentile of local rents. But it’s often not possible to find a suitable property at this price, and - even if properties were available - moving home is not always a feasible option particularly for disabled people, pensioners or parents with young children.
This problem is most acute for private renters who are single and under 35, who will mostly receive the Shared Accommodation Rate (SAR) of LHA - designed to cover the cost of renting a room in a shared house - whether or not they are actually living in a shared house. In reality, shared accommodation is often not suitable for people under 35 - for example if they are a parent with joint custody of a child. Even when it is, it’s not always possible to find shared accommodation that is covered by the SAR. This is reflected in the fact that only 4% of our debt clients who are eligible for the SAR live in shared accommodation that’s fully covered by the amount of housing benefit they receive under the SAR.
We can clearly see the detriment this causes among the people we help with debt advice who are eligible for the SAR. They have an average monthly shortfall of £246.70 between their housing support and rent costs - nearly £100 higher than the average monthly shortfall (£157) for the people we help who are renting privately and on UC overall.
Over a decade ago, the SAR age limit was extended from 25 to 35 years. While it was expected to save approximately £215 million per year, this was at the cost of pushing this group deep into the red: 70% of the people we help with debt advice who are eligible for the SAR are in a negative budget - significantly higher than the average for all of our debt clients (50%).
Reforms that look to bring LHA more into line with the actual rents people pay could make a significant difference to private renters struggling with high costs. But, the housing crisis can’t be solved through reforms to LHA alone. That’s why, alongside LHA reforms, the lack of affordable social housing needs to be urgently addressed, so that more low income renters can have a home with a secure tenancy and affordable rent.
7. Conclusions
If the government wants to turn the tide on living standards, it needs to look at the whole picture - how do you increase incomes, reduce the cost of essentials, and ensure no one is falling below the ultimate red line of negative budgets.
We’ve used our National Red Index to find the most effective and efficient way to start shifting the dial:
Legislate to uprate working-age benefits using inflation data from the Household Costs Indices, so they better reflect the true cost of living for low-income households.
Keep increasing the national minimum wage so more people in work can be lifted out of a negative budget.
Improve energy bill support by expanding eligibility for the Warm Home Discount and increasing support for those with the greatest energy needs.
Ensure affordable access to essential markets through social tariffs for water, broadband and motor insurance.
Reform the Local Housing Allowance so it better supports people with high private rent costs.
These changes should be seen as a first step to alleviate some of the pressure on negative budgets, which work could be started on within the first 100 days of a new government. They wouldn't completely reverse the problems we've seen, but it would start to make some genuine progress towards changes for the long term. They would lift 1.1 million people out of a negative budget, cutting the overall negative budget rate by a quarter and bringing it to the lowest rate since the cost of living crisis began.
| Policy recommendations | Households out of a negative budget in April 2024 |
|---|---|
|
Policy recommendations
Uprate working-age benefits using inflation data from the Household Costs Indices (HCI) |
Households out of a negative budget in April 2024
97,000 [18] compared to 44,000 with CPI uprating |
|
Policy recommendations
Keep increasing the National Minimum Wage to lift more households in work out of a negative budget. We’ve modelled the impact of raising the NMW to £12.87 - 75% of current median earnings. |
Households out of a negative budget in April 2024
110,000 [19] |
|
Policy recommendations
Tiered Warm Home Discount, which would offer £600 to households on means-tested benefits in the top quarter of energy use (1.95m households), with subsequent quarters receiving £400, £200 and nothing for the bottom quarter |
Households out of a negative budget in April 2024
97,000 |
|
Policy recommendations
Social tariff on water, broadband and motor insurance |
Households out of a negative budget in April 2024
72,000 |
|
Policy recommendations
Uprating and maintaining the Local Housing Allowance (LHA) at the 30th percentile of market rents |
Households out of a negative budget in April 2024
58,000 |
|
Policy recommendations
Combination of the above policies |
Households out of a negative budget in April 2024
466,000 [20] |
In the longer term, we need to see proper investment in the benefits system, a commitment to good quality work, alongside action on the unsustainable cost of energy and housing. This will take time and money, but through our analysis we’ve shown that even within fiscal limits it’s possible to start turning the tide. Equipped with this data, there’s no excuse for government inaction.
Endnotes
[1] Expert Panel biographies:
Dr Tim Leunig is a multiple international prize-winning economist and Director of Economics at PublicFirst Consultancy and Chief Economist at Onward think tank. He has taught at the London School of Economics for 25 years, and has held visiting Professorships in the US and continental Europe.
In his decade as a senior civil servant, he has served as education adviser to the Prime Minister, economic adviser to two Chancellors, as well as a senior policy adviser to six other UK Cabinet ministers in the Departments of Education, Health, Environment and Farming, and Housing and as Chief Analyst and Chief Scientific Adviser at the Department for Education. His many achievements include inventing Britain’s first ever jobs furlough scheme during the Covid-19 pandemic.
Tim writes regularly about policy in his substack, which you can read here.
James Browne is Head of Work, Income and Inequality Analysis at the Tony Blair Institute for Global Change. His research analyses labour market and fiscal policy, including the future of work, reforms to taxes and benefits and the design of a fiscal framework.
Nye Cominetti is a Principal Economist at the Resolution Foundation. His work covers the labour market, with a focus on low paid workers. He writes RF’s annual ‘Low Pay Britain’ report, and leads on the calculation of the real Living Wage. He has also written about the social care workforce, the impact of the Covid crisis, and pension contributions among low paid workers. You can find some of Nye’s recent work here.
Dr Peter Levell is an Associate Director at the Institute for Fiscal Studies (IFS). He has published several papers on the microeconomics of household spending and labour supply decisions over the life-cycle. He has also written about the measurement and impact of inflation and is a member of the ONS Technical Advisory Panel on Consumer Prices. He obtained his PhD in Economics from UCL in 2019. You can find Peter’s research and policy papers here.
[2] All figures in this report are for England, Scotland, and Wales only. The overall negative budget figure, including the figure for children, and the number of people ‘living on empty’ have been calculated using the inflation rate from the Household Costs Indices. All other figures have been calculated using the inflation rate from the Consumer Price Index. See section 2 for further details.
[3] To calculate the number of people in a negative budget, we multiplied the number of households in a negative budget (using figures from the National Red Index) by the ONS estimate for the average household size (2.36). To calculate the number of children in a negative budget, we multiplied the number of households with dependent children in a negative budget (using figures from the National Red Index) with the latest ONS data for the average number of dependent children per family in England and Wales (which we believe is a reasonable proxy for the average number of dependent children per family in the UK). As such, our figure for the number of children in a negative budget 1.5 million, only includes dependent children.
[4] Throughout this report, low-income refers to households in the bottom 2 income deciles.
[5] Flexible costs include energy; food and alcohol; communications and leisure; and clothing and footwear. Fixed costs include housing; health; transportation; and household bills like council tax and water.
[6] Our National Red Index uses real data from Citizens Advice debt clients and the LCFS for 2019/20, 2020/21, and 2021/22. To create a dataset for the current financial year (2023/24) and 2022/23, for which LCFS data was not yet available, we have taken the real data we have for 2020/21 and 2021/22 and adjusted it by inflation. We have one dataset for which we have used the CPI inflation rate, and another for which we have used the HCI inflation rate.
[7] Household Costs Indices (HCI) offer a more accurate measure for low income households because they include costs excluded by Consumer Price Index (CPI), weight households more equally, and take into account the share of income spent on different things. This last point is especially important because low-income households spend a larger share of their income on essentials, which is where we’ve seen the largest price rises. However, most living standards analyses use the CPI inflation rate. To enable our analysis to be comparable, and to provide a conservative view, we have also used CPI in our analysis throughout this report (aside from in calculating the overall negative budget rate). We expect these figures to be significant underestimates, as outlined by the comparison between the overall figures based on HCI (5m) and CPI (4.4m).
[8] We have calculated this figure by taking the average essential spending figures for 2019/20 and scaling them up by inflation. This gives us an expected average essential spending figure for 2023/24. Expenditure below this figure indicates a real-terms cut-back in essential spending. We have then calculated how many additional people would have been pushed into a negative budget if they had not cut back their spending in real terms.
[9] Names have been changed for anonymity.
[10] In this analysis, we have assumed that a typical family of four is a couple (both over 25 years-old) with two children. We have assumed that the first child was born before 6 April 2017, to make the comparison with pre-2017 outcomes fair. First children born before April 2017 have a higher UC child element. This means that monthly UC payments would be lower for families with 2+ children if both/all were born after 6 April 2017. The Universal Credit payment in this calculation does not include the UC housing element, therefore those claiming the UC housing element would receive higher monthly payments.
[11] See the endnote above about the assumptions we have made regarding the monthly Universal Credit payment for a typical family of four. For this analysis, we uprated UC monthly payments by the average Household Costs Indices (HCI) inflation rate for the bottom three income deciles from the September of each year between 2015 and 2023. This is in line with current UK government policy to uprate working-age benefits using the inflation figure from the September of the previous year. HCI has different inflation rates for different income deciles, so we chose the average HCI inflation rate for the bottom three income deciles to better reflect real inflation for low income households.
[12] Any figures on the percentage of income spent on different costs is calculated by dividing average total income (before housing costs) by average expenditure on relevant costs.
[13] If you are renting a social home, your ‘eligible rent’ is used to calculate your claim for Housing Benefit. This is your actual rent plus any service charges you have to pay (such as for lift maintenance or a communal laundry) but not things like heating or water costs for your home. However, Housing Benefit payments could be reduced for social renters who have a spare bedroom.
[14] For this analysis, we uprated working-age benefits by the average HCI inflation rate for the bottom three income deciles from the September of each year between 2015 and 2023. This is in line with current UK government policy to uprate working-age benefits using the inflation figure from the September of the previous year. HCI has different inflation rates for different income deciles, so we chose the average HCI inflation rate for the bottom three income deciles to better reflect real inflation for low income households.
[15] This figure was calculated by uprating working-age benefits by the average HCI inflation rate for the bottom three deciles. HCI has a different inflation rate for each income decile. We chose to use the average HCI inflation rate for the bottom three income deciles to reflect a more representative inflation rate for low-income households - this was 8.3% in September 2023. We also assumed that the National Minimum Wage was at £11.44 in April 2024 when making this calculation on the number of households lifted out of a negative budget.
[16] Our analysis of both uprating benefits and increasing the National Minimum Wage take April 2024 as their starting point. This means that in practice they are always modelled together. These analyses also take into account the Bank of England's most up-to-date projection of what inflation will be in the coming financial year, and keep income growth - other than income from benefits or minimum wage - at the same rate as inflation. Interactions between benefits and the NMW through taper rates, thresholds, and the benefit cap have also been factored in.
[17] This figure has been calculated while assuming that benefits were uprated by the September 2023 CPI inflation rate (6.7%) in 2024/5. If a £12.87 NMW was combined with uprating benefits by the September 2023 average HCI inflation rate for the bottom three income deciles (8.3%), then the figure for the number of households lifted out of a negative budget would be 163,000.
[18] This figure was calculated by uprating working-age benefits by the average Household Costs Indices (HCI) inflation rate for the bottom three deciles. HCI has a different inflation rate for each income decile. We chose to use the average HCI inflation rate for the bottom three income deciles to reflect the real inflation rate for low-income households. We also assumed that the National Minimum Wage was at £11.44 in April 2024 when making this calculation on the number of households lifted out of a negative budget.
[19] This figure has been calculated while assuming that benefits were uprated by the September 2023 CPI inflation rate (6.7%) in 2024/5. If a £12.87 NMW was combined with uprating benefits by the average HCI inflation rate for the bottom three income deciles (8.3%), then the figure for the number of households lifted out of a negative budget would be 163,000.
[20] This figure has been calculated by combining the policies in the above table through the National Red Index model. It takes into account how the policies interact with each other, such as a £12.87 National Minimum Wage and uprating benefits using HCI inflation data, and how combining policies can have a compounding impact on the number of people lifted out of a negative budget.